A lack of precision in defining the energy value of dietary fat could lead to losses for pork producers due to incorrect costing in diet formulations and disappointing performance outcomes.
November 1, 2017
By Trey A. Kellner, Iowa State University Department of Animal Science and AMVC Nutritional Services, Audubon, Iowa, and John F. Patience, Iowa State University Department of Animal Science
Fat is included in swine diets as a source of energy when the cost is economically advantageous. However, digestible energy, metabolizable energy and net energy content estimates of dietary fat have been variable and have not been fully validated (Kil et al., 2011; Boyd et al., 2015). A lack of precision in defining the energy value of dietary fat could lead to losses for pork producers due to incorrect costing in diet formulations and disappointing performance outcomes.
Thus, the objective was to determine the energy concentration of a diverse array of dietary fat sources and from these data develop regression equations that explain differences based on chemical composition. They could serve as prediction equations in the future. The hypothesis was that dietary fat DE variation among sources can be better explained using more detailed chemical composition than previous attempts.
A total of 120 Genetiporc 6.0 × Genetiporc F25 (PIC Inc., Hendersonville, Tenn.) barrows in two sequential replicate groups of 60 barrows each were studied. These barrows (initial body weight of 9.9 ± 0.6 kilograms) were allotted at random to one of 15 dietary treatments: (control, animal-vegetable blend, canola oil, choice white grease source A, choice white grease source B, coconut oil, corn oil source A, corn oil source B, fish oil, flaxseed oil, palm oil, poultry fat, soybean oil source A, soybean oil source B and tallow).
Each experimental diet included 95% of a corn-soybean meal basal diet plus 5% of either corn starch (control) or one of the previously listed 14 dietary fat sources. Dietary fat sources were selected to provide a diverse range of degree of unsaturation (Figure 1). Pigs were fed their assigned diets from Day 0 to 10 and Day 46 to 56. Pigs were housed individually throughout the 56-day experiment. Fecal grab samples were collected fresh from Day 7 to 10 and Day 53 to 56. Digestible energy values were determined directly, and ME and NE values were determined from DE using constant conversion factors (National Research Council, 2012). All energy content values are reported on an as-fed basis.

Figure 1: Range of dietary fat sources that can be included in swine diets, arranged by degree of unsaturation from top left (coconut oil [unsaturated to saturated fatty acid concentration ratio of 0.01]) to bottom right (canola oil [unsaturated to saturated fatty acid concentration ratio of 13.60])
The DE, ME and NE variation among dietary fat sources at 13 kilograms body weight was largely explained (R2 = 0.82) by a stepwise regression model with intercepts of 9.36, 9.18 and 8.08 megacalories per kilogram for DE, ME and NE respectively (Table 1).
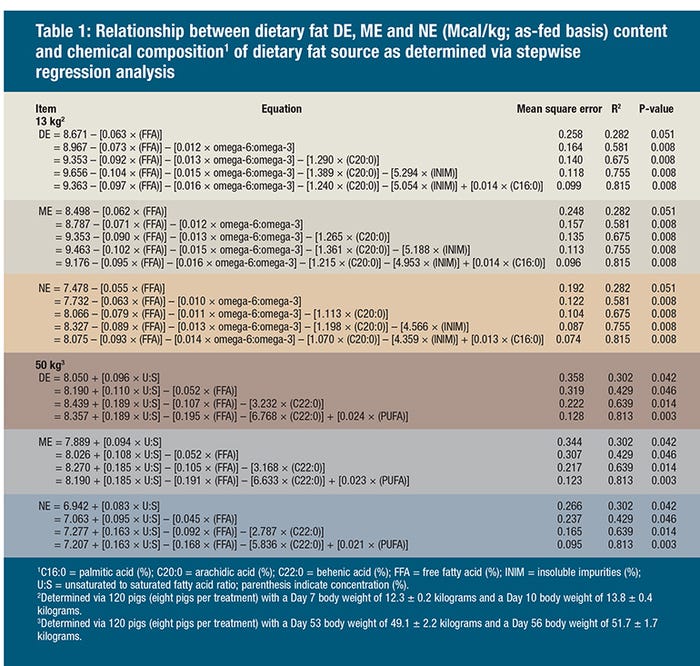
The models suggest that the energy value of dietary fat for the young pig declines with increased free fatty acids, omega-6:omega-3 ratio, insoluble impurities and C20:0 (arachidic acid) content and rises with increasing C16:0 (palmitic acid) concentration (P = 0.008).
The variation in DE, ME and NE in 50-kilograms pigs was largely explained (R2 = 0.81) by a stepwise regression model with intercepts of 8.35, 8.19 and 7.21 megacalories per kilogram for DE, ME and NE, respectively (Table 1).
The model further suggested that the energy value of dietary fat for growing pigs was increased by increased dietary fat U:S (ratio of unsaturated:saturated fatty acids) and polyunsaturated fatty acid content and declined with increased FFA level and behenic acid (C22:0) concentration (P = 0.002).
Assigning accurate energy values to dietary fat sources not only allows pork producers to appropriately value dietary fat relative to other sources of energy, but also supports differentiation of available fat sources. Previous prediction equations used dietary fat U:S and FFA level as prediction variables (Powles et al., 1995; Rosero et al., 2015). In those equations, dietary fat DE content rose with increased U:S (Powles et al., 1995; NRC, 2012). Unsaturated fatty acids are more soluble when exposed to bile salts, which may increase their incorporation into mixed micelles and facilitate subsequent absorption (Stahly, 1984; Wiseman et al., 1986). In the data reported here, increased U:S resulted in increased fat DE content at 50 kilograms body weight, but not at 13 kilograms body weight.
The difference between the two stages of growth may possibly be due to bile secretion. Increased bile secretion by the liver was first proposed by Lloyd et al. (1957) to be the reason that fat digestion increased with pig age. Walker (1959) reported that the bile volume in the gall bladder is minimal in the young pig and is slow to increase over the early stages of growth. A gradual increase in bile salt secretion due to increased age in growing pigs was also reported by Harada et al. (1987). Thus, if bile salt exposure to fatty acids in the small intestine is greater with increased age, then the solubility of unsaturated fatty acids would similarly increase with age. However, the data reported in Powles et al. (1995) does not support this explanation, as they observed that the impact of U:S was greater in 12-kilogram pigs than in 30- to 90-kilogram pigs.
The 14 fat sources evaluated in this experiment provided a wide range of U:S. They did not, however, vary much in FFA levels (≤ 13.4%). Despite this, FFA level was still a significant variable that decreased the energy value of dietary fat sources. For the younger pig, the negative effects of FFA were reduced if the dietary fat source was also highly unsaturated. Powles et al. (1995), using growing pigs, and Rosero et al. (2015) using lactating sows, also reported that saturated FFA lowered DE more than unsaturated FFA. Wiseman (1991) suggested that FFA, compared with esterified fatty acids could suppress bile salt secretion, resulting in a subsequent decrease of fatty acid incorporation into mixed micelles and thus absorption. Unsaturated FFA are more effectively digested than their saturated FFA counterparts due to their being less hydrophobic (Liu et al., 2015), which in turn makes them less reliant on bile salts for emulsification and micelle incorporation (Liu et al., 2015).
The NRC (2012) estimate of the DE content of various fat sources is based on Powles et al. (1995). This series of experiments (Wiseman et al., 1990; Powles et al., 1993, 1994) used blends of dietary fat sources that ranged from 0.66 to 15.67 U:S and 0.8% to 81.8% FFA level. However, these experiments included dietary fat sources with primarily 16 or 18 carbon fatty acids. Therefore, the utility of the Powles et al. (1995) equation is unknown for shorter-chain fatty acid sources (i.e., COCO) or longer-chain fatty acid sources (i.e., FISH; NRC, 2012). Powles et al. (1995) related the DE content to chemical composition as follows: DE, kilocalories per kilogram = {36.898 – [(0.005 × FFA, gram per kilogram) – (7.330 × exp(-0.906 × U:S)]} / 4.184.
Input of the analyzed composition of the 14 dietary fat sources into the Powles et al. (1995) equation generated an average predicted DE of 8.43 megacalories per kilogram (Table 2 and 3). The average observed DE content of the 14 dietary fat sources herein was 8.42 megacalories per kilogram at 13 kilogram body weight and 8.45 megacalories per kilogram at 50 kilograms body weight, respectively. Thus, the PBais of Powles et al. (1995) equation to the observed DE content of dietary fat was minimal.
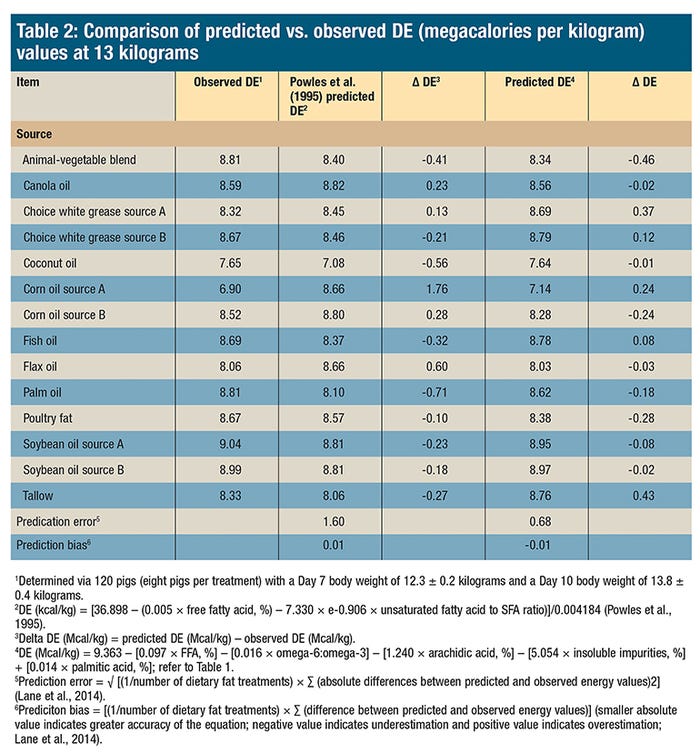
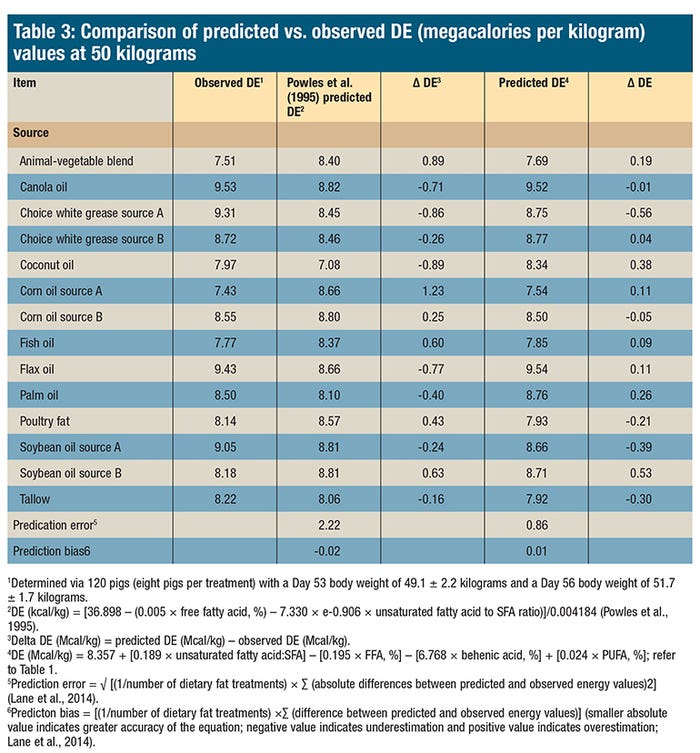
However, at both 13 kilograms and 50 kilograms body weight, the Powles et al. (1995) equation underestimated the DE content of saturated fat sources coconut oil and palm oil and overestimated the DE content of corn oil source A to a large degree. Comparison of the equations generated herein to the Powles et al. (1995) equation is unfair as these equations were fitted to the same dataset to which they are being compared. Thus, validation of these equations in additional experiments is needed to determine if they are more precise than the Powles et al. (1995) equation across the wide range of dietary fat sources used by the swine industry.
The approach herein for estimating dietary fat ME and NE content was modeled after the approach used by NRC (2012). Calculations of ME and NE from DE were based on diets containing 7% vegetable oil using indirect calorimetry (van Milgen et al., 2001). They estimated the conversion of DE to ME to be 98% and ME to NE to be 88%. The ME and NE estimates reported herein assume that the conversion of DE to NE is the same across all fat sources. The NRC (2012) ME and NE estimates are, of course, subject to the same assumption. More studies are required to determine if these relationships are correct and can be broadly applied to many different fat sources.
The chemical composition of dietary fat explained a large degree of the variation observed in the energy content of dietary fat sources. However, the relationship between the energy content of dietary fat and the chemical composition of dietary fat was not the same at 13 kilograms and 50 kilograms body weight, respectively. The Powles et al. (1995) equation accurately predicted the average DE content of the 14 sources. However, these data have identified two potential weaknesses of the equation. The Powles et al. (1995) equation incorrectly predicted the DE content of saturated sources of dietary fat that are composed of fatty acid chain lengths < 16 carbons and underestimated the negative impact of FFA. Further research is needed to validate the equations generated herein when predicting the DE content of diverse fat sources.
Financial support for this research was provided by the National Pork Board, Clive, Iowa. Appreciation is expressed to DSM and Ajinomoto Heartland Inc. for in-kind contributions.
References
Boyd, R. D., C. E. Zier-Rush, M. McGrath, R. Palan, J. Picou and E. van Heugten. 2015. Calibration of net energy for fat by growth assay in early and late phases of growth in pigs. J. Anim. Sci. 93(Suppl 2):73.
Harada, E., H. Kiriyama, E. Kobayashi and H. Tsuchita. 1988. Postnatal development of biliary and pancreatic exocrine secretion in piglets. Comp. Biochem. Physiol. 91:43-51.
Kil, D.Y., F. Ji, L.L. Stewart, R.B. Hinson, A.D. Beaulieu, G.L. Allee, J.F. Patience, J.E. Pettigrew and H.H. Stein. 2011. Net energy of soybean oil and choice white grease in diets fed to growing and finishing pigs. J. Anim. Sci. 89:448-459. doi:10.2527/jas.2010-3233.
Lane, D. M., D. Scott, M. Hebl, R. Guerra, D. Osherson and H. Zimmer. 2014. Introduction to statistics. Rice Univ., Houston, TX. P. 474-476.
Liu, M. S., P. Green, J. J. Mann, S. I. Rapoport and M. E. Sublette. 2015. Pathways of polyunsaturated fatty acid utilization: implications for brain function in neuropsychiatric health and disease. Brain. Res. 9:220-246. doi:10.1016/j.brainres.2014.11.059.
Lloyd, L. E., E. W. Crampton and V. G. MacKay. 1957. The digestibility of ration nutrients by three vs. seven week old pigs. J. Anim. Sci. 16:383-388. doi:10.2527/jas1957.162383x.
NRC. 2012. Nutrient requirements of swine. 11th rev. ed. Natl. Acad. Press, Washington, DC.
NRC. 1998. Nutrient requirements of swine. 10th rev. ed. Natl. Acad. Press, Washington, DC.
Powles, J., J. Wiseman, D. J. A. Cole and S. Jagger. 1995. Prediction of the apparent digestible energy value of fats given to pigs. Anim. Sci. 61:149-154. doi:1357-7298/95/45810149S20.00111.
Powles, J., J. Wiseman, D. J. A. Cole and B. Hardy. 1994. Effect of chemical structure of fats upon their apparent digestible energy value when given to growing/finishing pigs. Anim. Prod. 57:137-146.
Powles, J., J. Wiseman, D. J. A. Cole and B. Hardy. 1993. Effect of chemical structure of fats upon their apparent digestible energy value when given to growing/finishing pigs. Anim. Sci. 57:137-146. doi:10.1017/S000335610000670X.
Rosero, D. S., J. Odle, C. Arellano, R. D. Boyd and E. van Heugten. 2015. Development of prediction equations to estimate the apparent digestible energy content of lipids when fed to lactating sows. J. Anim. Sci. 93:1165-1176. doi:10.2527/jas2014-8402.
Stahly, T. 1984. Use of fats for growing pigs. In: J. Wiseman, editor, Fats in animal nutrition. Buttersworths, Boston, MA. P 313-331.
van Milgen, J., J. Noblet and S. Dubois. 2001. Energetic efficiency of starch, protein, and lipid utilization in growing pigs. J. Nutr. 131:1309-1318.
Villamide, M. J. 1996. Methods of energy evaluation of feed ingredients for rabbits and their accuracy. Anim. Feed Sci. Tech. 57:211-223.
Walker, D. M. 1959. The development of the digestive system of the young animal. II. Carbohydrase enzyme development in the young pig. J. Agr. Sci. 52:357-363.
Wiseman, J., F. Salvador and J. Craigon. 1991. The influence of free fatty acid content and degree of saturation on the apparent metabolizable energy value of fat fed to broilers. Poult. Sci. 70:1527-1533.
Wiseman, J., D. J. A. Cole and B. Hardy. 1990. The dietary energy values of soya-bean oil, tallow, and their blends for growing/finishing pigs. Anim. Prod. 50:513-518.
Wiseman, J., D. J. A. Cole, F. G. Perry, B. G. Vernon and B. C. Cooke. 1986. Apparent metabolizable energy values of fats for broiler chicks. Br. Poult. Sci. 27:561-576. doi:10.1080/0071668608416915.
You May Also Like


