

Subscribe to Our Newsletters
National Hog Farmer is the source for hog production, management and market news
USDA lowered estimated yield but still the second highest national average yield expected for corn.
September 14, 2015

Corn futures prices rose while soybean prices fell slightly after the USDA released its September estimates of U.S. grain and oilseed supplies and utilization on Friday. Analysts’ pre-report estimates and key output figures from Friday’s World Agricultural Supply and Demand Estimates report appear in Figure 1. Full supply and utilization data for corn and soybeans appear in Figures 2 and 3.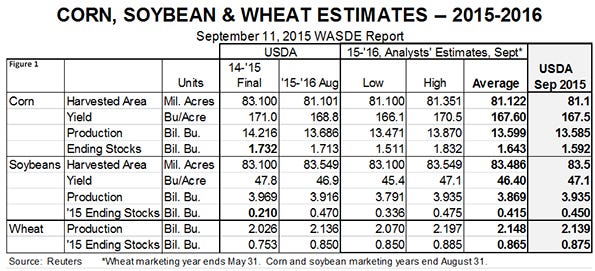
As expected, the USDA lowered its estimated yield in this report. The new estimate of 167.5 compares to 168.8, and would still be the second highest national average yield ever. The estimated decline was driven by lower yield estimates in every major Midwestern state except North Dakota and Illinois, where estimated average yields were raised by two and one bushels, respectively.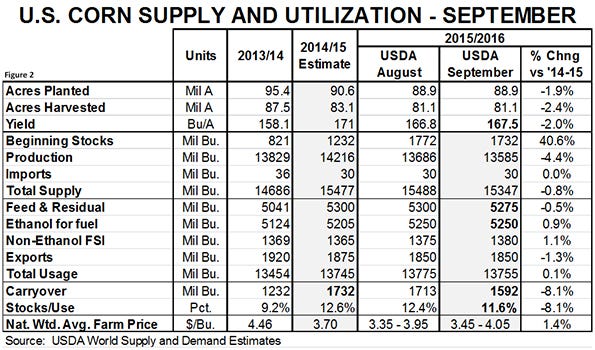
The USDA did not change projected harvested acres for corn, so the lower yield pushed the 2016 crop to 13.585 billion bushels, slightly lower than the August estimate of 13.599 billion bushels.
Year-end 2015 stocks were reduced to 1.732 billion bushels in this report due to a 25-million bushel increase in projected current-year exports and 5 million bushel increases in both ethanol and non-ethanol industrial usage. The net impact of the changes reduced the USDA’s projected new crop carryover by 140 million bushels. The new forecast of 1.592 billion bushels would be 11.6% of projected 2015-016 usage, 1 full percent lower than the projected stocks-use ratio for this year.
The USDA raised its estimate of the national average farm price by 10 cents per bushel with the mid-point of the forecast range now being $3.75, $0.05 or 1.4% higher than this past year. As has been the case for some time, we need to continue to keep these prices in perspective relative to the past six years – they are not low but they are far more reasonable, especially relative to livestock price levels.
This could indeed mark a low for the corn market, but I see little limited upside potential. The factor that could make harvest-time corn purchases advisable will be basis. I heard of sub-$3 corn in South Dakota last week before the report. That is indicative of some weak basis levels in the western Corn Belt where a good amount of 2014 corn is still in bins and elevators. The opposite will be true in the east where short crops will keep basis levels tight.
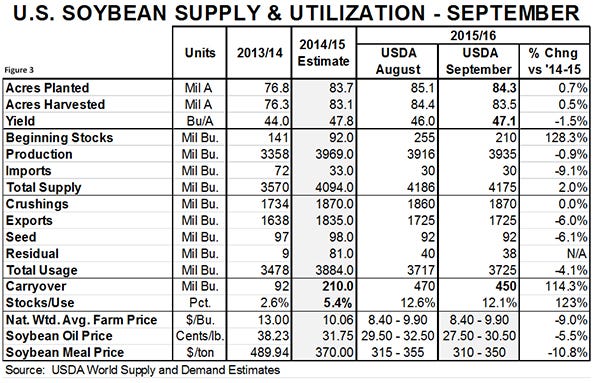
The USDA raised its estimate of the national soybean yield to 47.1 bushels per acre from 46.0 in August, increasing the total crop estimate to 3.935 billion bushels, only slightly smaller than last year’s record of 3.969 billion bushels.
A small change in old-crop imports (+3 million bu.) and larger changes in exports (+10 million bu.) and crushings (+25 million bu.) pushed projected 2015 year-end stocks down to 220 million bushels. That change, plus the changes in 2015 crop estimates, shaved 20 million bushels off the USDA’s August projection for 2016 year-end stocks but the 450 million bushel figure is still 35 million bushels larger than analysts had, on average, expected. Soybeans are higher in Monday trading after selling off slightly after the report on Friday.
The USDA lowered its estimate for soybean oil price due to lower oil and diesel values. Lower oil means that meal will have to carry more of the crush value in the year to come. Friday’s report pushed meal prices lower but they have rebounded by $3 to $3.50 per ton in Monday trading. Many observers believe that soybean yields will actually decline from the levels measured in this month’s report. If so, we may have seen the meal market make a low.
Regardless, we doubt that there is much bottom-side potential in this market with China apparently beginning to catch up on its bean orders. Hog producers are not likely to forego much savings buying meal at these levels.
As of mid-morning on Monday, my model has farrow-to-finish costs just under $70 per hundredweight carcass (see Figure 4). That compares to $71.83 last year and would be the lowest annual average production cost figure since 2007. At mid-morning Monday Lean Hogs futures price levels, producers could lock in profits of just over $5 per head for 2016. The best operations will be $5 per hundredweight lower on costs and about $10 per head better on profits.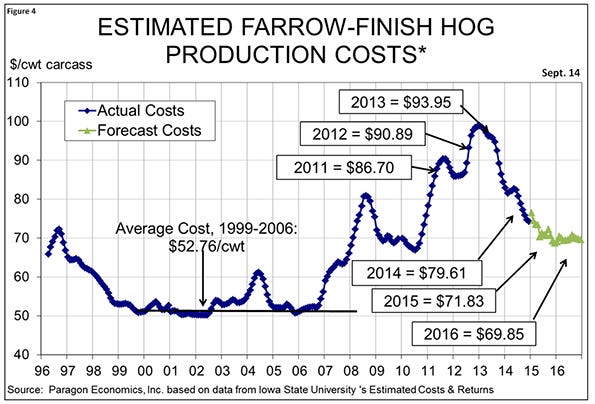
Note: Canadian hog price data for the week ending Sept. 5 in the “North American Pork Industry Data” table were not available this morning. 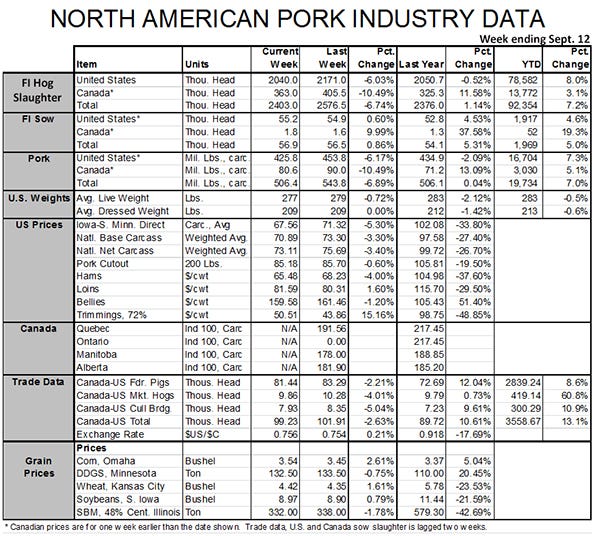
You May Also Like
Enter a zip code to see the weather conditions for a different location.


