

Subscribe to Our Newsletters
National Hog Farmer is the source for hog production, management and market news
USDA’s most recent quarterly Hogs & Pigs Report, released March 30, contained no big surprises, but it provided some fodder for both optimists and pessimists as they look to future hog markets.
April 2, 2012

USDA’s quarterly Hogs & Pigs Report, released Friday, contained no big surprises, but it provided some fodder for both optimists and pessimists as they look to future hog markets.
At mid-morning on Monday (today), Chicago Mercantile Exchange (CME) Group Lean Hogs futures prices are $0.38 to $0.80/cwt., carcass, higher for contracts through February 2013. The summer 2013 contracts are over $1.30/cwt., carcass, higher on very light volume.
One caution about these increases – the entire commodities complex appeared to me to be very oversold going into Friday’s reports. Those USDA reports included the Prospective Plantings and Grain Stocks, the latter of which has been famously erratic over the past couple of years. Today’s positive price move may be more of a response to that oversold condition than to anything in the Hogs & Pigs report. Only time will provide us with some insight about the driver of today’s market.
The key national data from the Hogs & Pigs report appear in Figure 1.
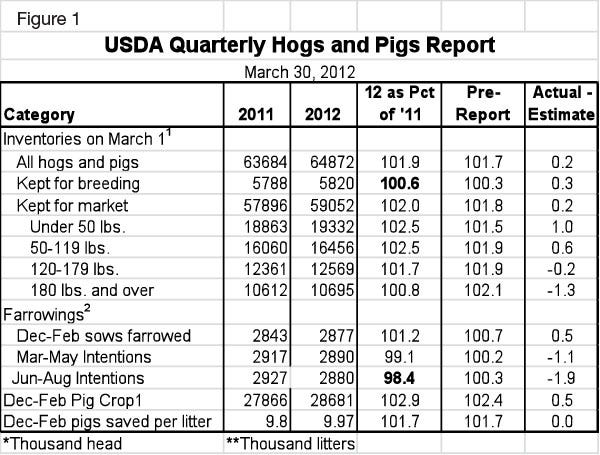
Some highlights in Figure 1 include:
· A national breeding herd of 5.82 million head, 0.6% more than one year ago but still quite small from a historical perspective. This number was a bit larger than analysts had expected, but was right in line with our thoughts. We’ve heard of a few sow units being built and Cargill’s repopulation of the old Smithfield/Premium Standard Farms system in Texas continues. But the growth rate is still quite slow in historical terms.
· Two percent more hogs kept for market. That is pretty much in line with expectations, but the weight categories show pretty stark differences. The numbers of pigs weighing less than 120 lb. were larger than expected, while the heavier categories contained fewer hogs than expected. One reason for that is another very high expectation for pigs weighing over 180 lb. This year’s federally inspected slaughter for March was only slightly larger than last year’s total after adjusting for one fewer week day and one more Saturday this year. Close enough to the 100.8% in the report to say the report is okay vs. slaughter. Analysts’ 2.1% was far too large to begin with.
· Litter size growth of 1.7%, year-on-year. That number is the same as we saw in the December report, but it is slightly lower than the 2% rate seen the past four years. I still think litters will continue to grow but at a slightly slower pace. The 9.97 pigs/litter saved is a new record for the Dec.-Feb. quarter, breaking last year’s mark by 0.17 pigs/litter.
· A Dec.-Feb. pig crop of 28.681 million head, 2.9% larger than last year. That number is close enough to the +2.5% in the under 50-lb. category to be consistent. It also fits perfectly with Dec.-Feb. farrowings and litter size. The question that remains, however, is does it pass the PRRS test? I have already received e-mails asking whether this can be right given all of the anecdotal evidence of severe losses associated with porcine reproductive and respiratory syndrome (PRRS) over the last several months. As I noted two weeks ago in Weekly Preview, I am not factoring in PRRS losses in my forecasts. Until proven wrong, I’ll stand by that – and the USDA data agree with my points of view. I don’t know whether to take solace in that or not.
· Continued screwy numbers on farrowing intentions. The next two quarters at 99.1% and 98.4% of last year don’t jibe with a growing breeding herd. To USDA’s credit, they are consistent. The 99.1% for March-May is the same as it was in December. Still, I find it hard to believe that we will lose farrowing efficiency, especially with this year’s mild winter. I know winter weather has far less impact than it once did, but I don’t think its influence is zero just yet!
Here’s the Bottom Line
Figure 2 shows the implied weekly slaughter rates for 2012 and the first quarter of 2013. The latter is difficult to see in the chart since it differs only 0.1% from the 2012 levels.
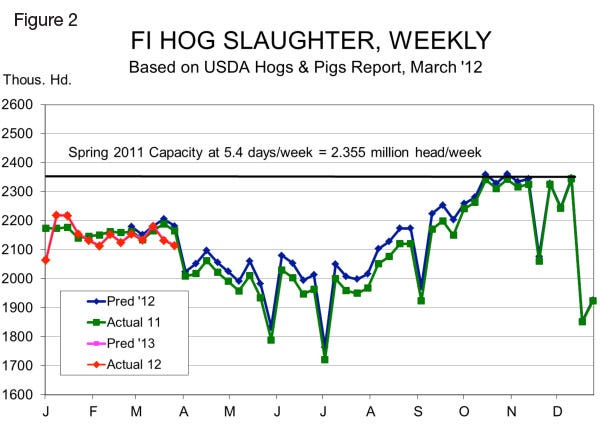
Note that actual slaughter the past two weeks has been significantly lower than the predicted levels. That is a continuation of actual-vs.-predicted relationships out of the December report over the past few weeks. I have contended that we have pushed some hogs back due to low packer margins. Lower slaughter and rising weights support my position. But continued strong cash hog prices relative to the cutout value suggest that packers are chasing pigs aggressively, perhaps pulling them forward with higher weights the result of exceptional winter performance, which has been confirmed by some of my contacts. I certainly hope it is the latter, as that would fuel a cash rally as hog numbers begin their seasonal decline.
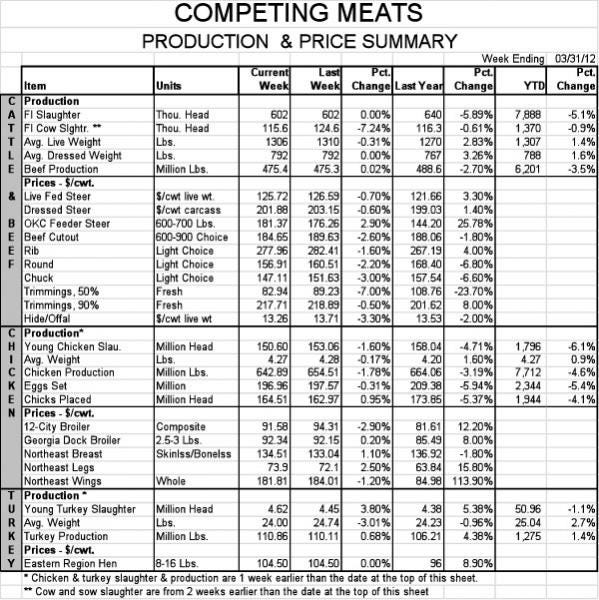
The analysts’ price forecasts that I use in my table were not available this morning, so I will include the forecast tables in next week’s edition. See North American Pork Industry Data and Competing Meats Tables below.

You May Also Like
Enter a zip code to see the weather conditions for a different location.


