

Subscribe to Our Newsletters
National Hog Farmer is the source for hog production, management and market news
So what do we do now? The USDA’s monthly World Supply and Demand Estimates (WASDE) report last week was indeed as bleak as analysts had feared. In fact, the national corn yield estimate of 123.4 bu. /acre was nearly 3 bu. lower than the average of analysts’ pre-report estimates.
August 13, 2012

So what do we do now? The USDA’s monthly World Supply and Demand Estimates (WASDE) report last week was indeed as bleak as analysts had feared. In fact, the national corn yield estimate of 123.4 bu. /acre was nearly 3 bu. lower than the average of analysts’ pre-report estimates (Figure 1). USDA’s forecast crop of 10.779 billion bushels, though, was close enough to the level that was “in the market” prior to Friday that old crop September futures fell by $0.18/bu. and new crop December futures declined by $0.145/bu. Both contracts are roughly 12 cents lower in mid-morning Monday trading.
Corn’s Changing Value
The crop year will start with a little bit of good news – larger year-end (2012) carryout stocks. This means that high prices this summer have already driven some reductions in usage and exports, leaving more corn in the bins to carry into the 2012-13 crop year. The increase was only 76 million bushels, bringing the total to 1.021 billion, but we will take all we can get at this point.
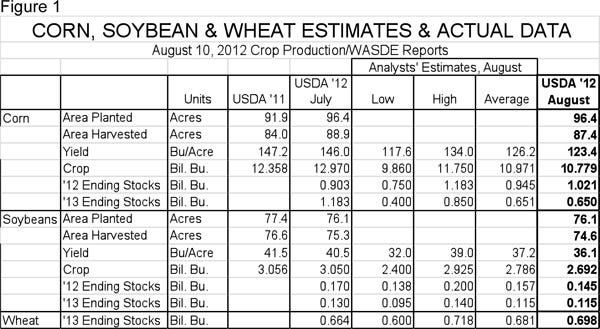
The smallest U.S. corn crop since 2006, however, will push 2013 year-end stocks to an extremely tight 650 million bushels, the lowest level since 1996, when only 426 million bushels remained at year’s end. The projected year-end stocks-to-use ratio for 2013 is 5.8%, also the lowest since 1995, when those 426 million bushels represented only 5% of total 1995-96 usage.
So why was the average corn price only $3.24 in 1995-96, while the USDA projected average this year is set between $7.50 and $8.90/bu.? The answer lies in “value in use.”
The price of corn is determined by its value as an input to other things – corn flakes, tortillas, animal feed, etc. (Figure 2). Back in 1995-96, 63% of all corn was used for feed and 30% went to exports. Non-ethanol food, seed and industrial (FSI) used another 14%. Ethanol took only 7%. Very little of the crop’s value was tied to non-food energy.
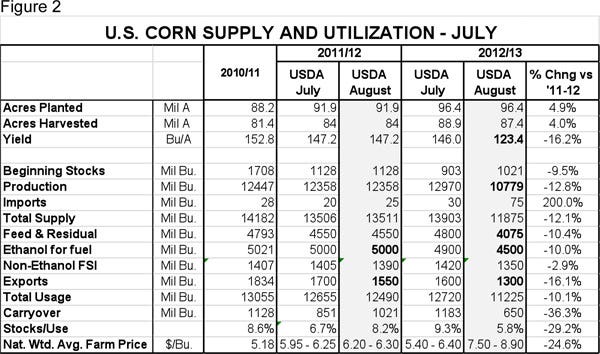
This year, 40% is projected to go to ethanol, while only 38.5% will go to feed. Exports and non-ethanol FSI will account for 14.7% and 11.3%, respectively. Further, consider that the average price of gasoline in the 1995-96 crop year was $0.59/gal. That is not a typographical error! The average price of oil was $19.91/barrel. There is no question about what is driving the value bus today with oil at $92/bbl and gasoline at $$3.68/gal.
The big question in my mind is how the animal protein sectors get down to only 4.075 billion bushels of feed usage. Figure 3 shows data for USDA’s annual estimates of corn feed and residual (F/R) usage, plus domestic distillers’ dried grains with solubles (DDGS) usage, as well as a prediction equation for that total based on Dec. 1 total hog inventory in the harvest year, Jan. 1 cattle-on-feed and dairy cow inventory in the succeeding year and chicken and turkey production in the succeeding year. Remarkably, this equation does a pretty good job of predicting corn F/R plus DDGS usage, explaining 94.8% of the historical variation.
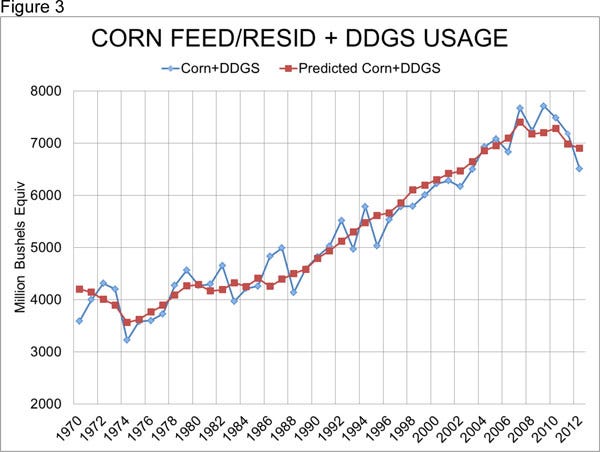
The shock comes when one plugs in USDA forecasts for 2013 chicken and turkey production and some reasonable assumptions for hog, cattle-on-feed and dairy cow inventories. The predicted F/R plus DDGS usage comes in at over 400 million bushels higher than USDA’s current forecasts. How do we save that much feed?
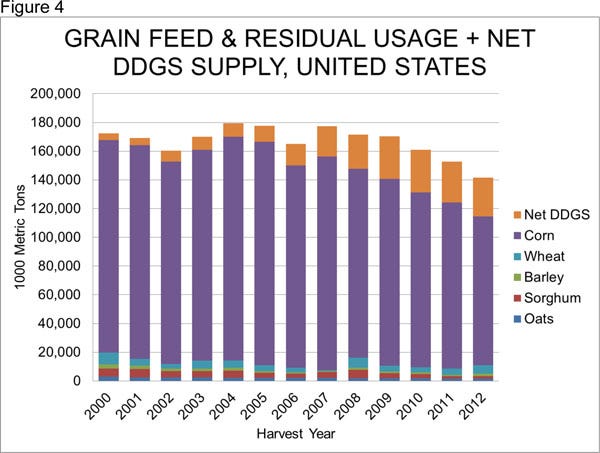
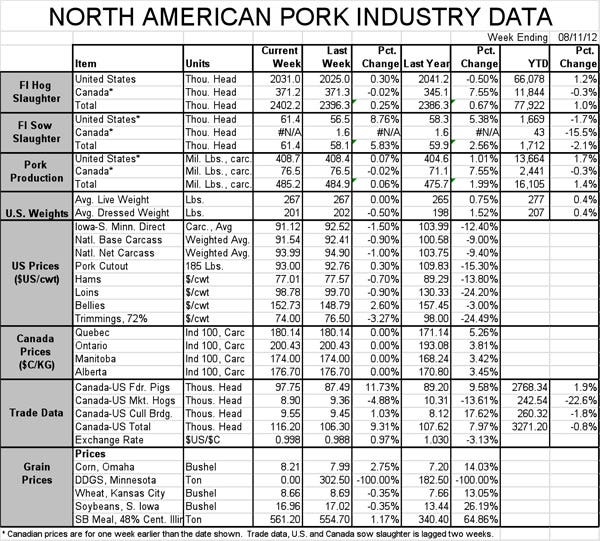
Remember, USDA has already factored in higher usage of wheat and other grains for feed. Figure 4 shows the amounts of corn, wheat, barley, sorghum, oats and DDGS that USDA says has been and will be used for feed/residual. This year’s total of 141.596 million metric tons is 22.1% lower than the peak back in 2004 and is 7.2% lower than last year. When anyone says, “Feed them something else,” the accurate response is, “There is not enough of ‘something else’ either!”
Cutbacks Underway
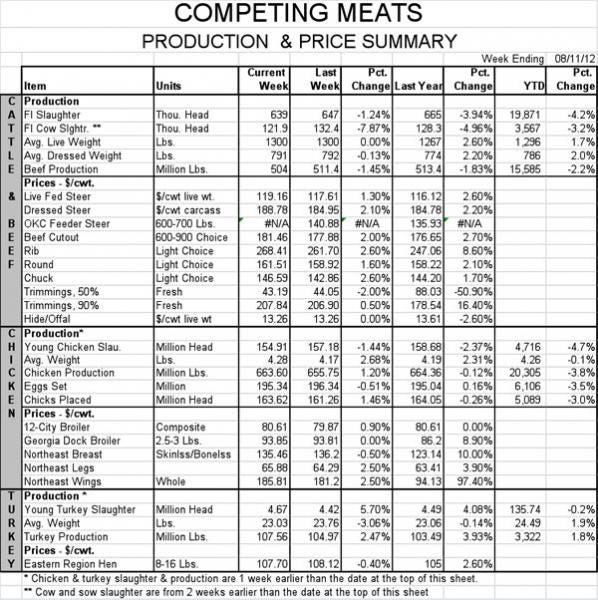
Livestock cutbacks have commenced. Dairy cow slaughter is up sharply over the past month, which is a good sign since dairy cows count much larger in the feed/grain balance sheet. Reducing their number will have immediate impacts. Sow slaughter has also increased, but that has little impact on short-term feed use. Lower sow numbers now will mean lower pig numbers next summer, allowing us to stretch feed supplies further. Shipping beef cows does little to save on concentrates, but some will move to town due to poor pasture conditions and skyrocketing hay prices. The poultry sector could have an immediate impact on feed usage as well, but they have already cut back and their losses so far are relatively small. I don’t think we can count on much help from the feathers crowd.
Substitute whatever you can. Start reducing feed usage in finishers by shipping pigs at lighter weights now! You won’t be able to in a few weeks. Reduce daily sow diets to the lowest possible levels that will maintain welfare and productivity. Make sure nothing goes to waste. Don’t put a pig on feed unless it is going to be extremely efficient. Treat sick pigs appropriately and practice timely, humane euthanasia. And, consider cultivating a roaster pig trade in your area. It may sound ridiculous, but we are going to need all the help we can get!
You May Also Like
Current Conditions for
50°F
Mostly Cloudy
Day 56º
Night 48º
Enter a zip code to see the weather conditions for a different location.


