Subscribe to Our Newsletters
National Hog Farmer is the source for hog production, management and market news
As more farms set their sights on achieving 30 pigs weaned/mated female/year (PW/MF/Y), we have been asked to help identify the production parameters needed to hit that goal. We have 17 farms in the Swine Management Services’ (SMS) database that have exceeded 30 PW/MF/Y for a 52-week period. In this dataset, five different genetic companies are represented. Farm sizes range from 300 to 5,000-plus sows, and they are located throughout the Midwest, the East Coast and south-central Canada.
July 9, 2012

As more farms set their sights on achieving 30 pigs weaned/mated female/year (PW/MF/Y), we have been asked to help identify the production parameters needed to hit that goal. We have 17 farms in the Swine Management Services’ (SMS) database that have exceeded 30 PW/MF/Y for a 52-week period. In this dataset, five different genetic companies are represented. Farm sizes range from 300 to 5,000-plus sows, and they are located throughout the Midwest, the East Coast and south-central Canada.
Looking for more detail, we selected 493 farms (876,101 mated females) from the 811 farms (1,414,000 females) in our database. Farms had to be in full production for 52 weeks, average at least 20 PW/MF/Y with no start- ups or repopulations, no parity segregation and no major disease breaks. Farms were broken into six categories as follows:
30 PW/MF/Y or more
28 to 29.9 PW/MF/Y
26 to 27.9 PW/MF/Y
24 to 25.9 PW/MF/Y
22 to 23.9 PW/MF/Y
20 to 21.9 PW/MF/Y
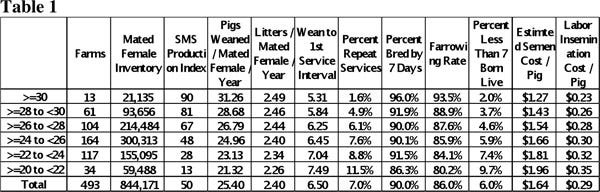
Table 1 lists the number of farms per category and total number of mated females. Production numbers for this article are broken down by PW/MF/Y, litters/mated female/year (L/MF/Y), wean-to-1st service interval, percent repeat services, percent bred by seven days postweaning, farrowing rate and percent less than seven pigs born alive. To add some cost figures, we estimated semen cost/pig and insemination labor cost/pig.
As Table 1 shows, PW/MF/Y averaged 25.40 in the 493-farm subset, with the top 13 farms averaging 31.26 PW/MF/Y. The bottom 34 farms averaged 21.32 PW/MF/Y. The difference can be attributed to higher farrowing rates, finding returns to estrus sooner and lower wean-to-1st service intervals.
Wean-to-1st service interval ranged from 5.31 days for farms with 30 or more PW/MF/Y to 7.49 days for the farms with 20 to 21.9 PW/MF/Y. Farrowing rates in the top 13 farms averaged 93.5% vs. the bottom 34 farms, which averaged 80.2%. If a 1% improvement in farrowing rate boosted PW/MF/Y by 0.34 pigs, the difference of 13.3% in farrowing rate improves PW/MF/Y by 4.5 pigs.
With more pigs produced, semen cost/pig ranges from $1.27/pig in the 30+ PW/MF/Y farms to $1.96/pig in farms producing 20 to 21.9 PW/MF/Y – a difference of $0.69/pig. We used a semen cost of $7.00/bag or bottle.
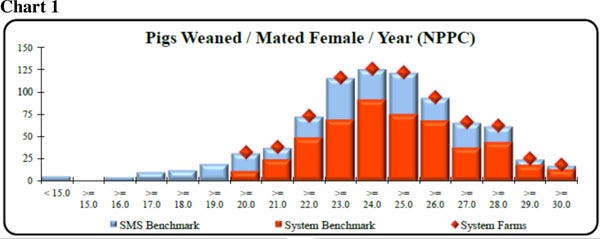
Chart 1 gives you a look at the large amount of variation in PW/MF/Y with farms less than 15 PW/MF/Y up to 17 farms with over 30 PW/MF/Y. The average of the full 811-farm SMS database is 24.78 PW/MF/Y with the subset of 493 farms at 25.40 PW/MF/Y.
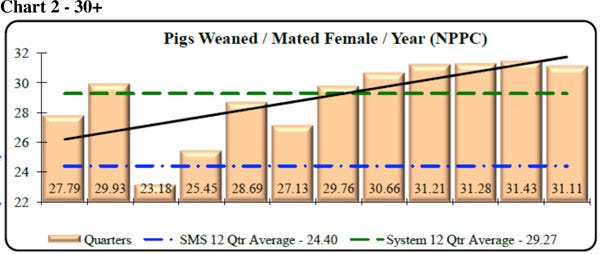
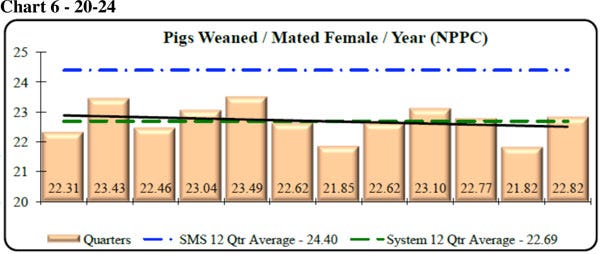
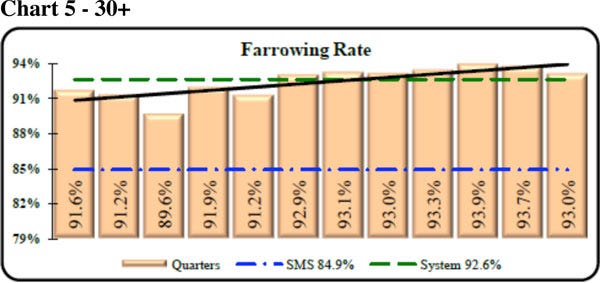
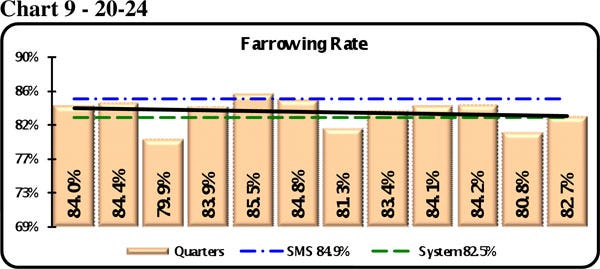
To show the improvement or slippage over the last 12 quarters (three years), we created Charts 2 to 9. The 13 farms at 30+ PW/MF/Y and the 151 farms at 20 to 23.9 PW/MF/Y were combined into one group to show what happened over those three years, by quarter.
There was some quarterly variation, with the solid black line being the trend line. Charts 2 and 6 compare the two subgroups where the 30+ PW/MF/Y farms range from 23.18 to 31.34 PW/MF/Y, with the trend line improving. In Chart 6, the range is 21.82 to 23.49 PW/MF/Y and the trend line is flat or trending downward.
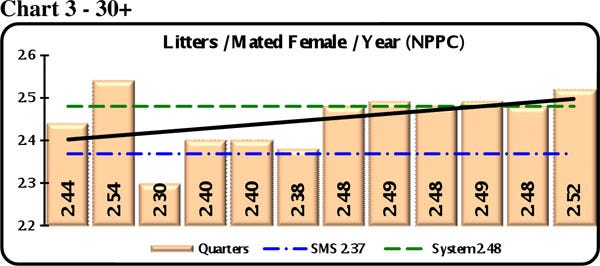
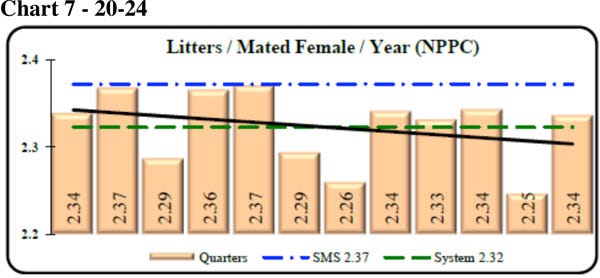
Charts 3 and 7, Litters/Mated Female/Year (L/MF/Y) shows the top 13 farms ranged from 2.44 to 2.52 L/MF/Y, while the 151 farms with less than 24 pigs remained flat at 2.34 L/MF/Y.
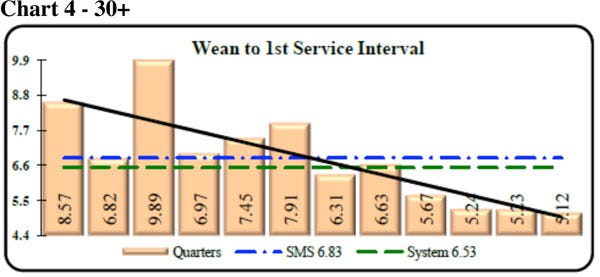
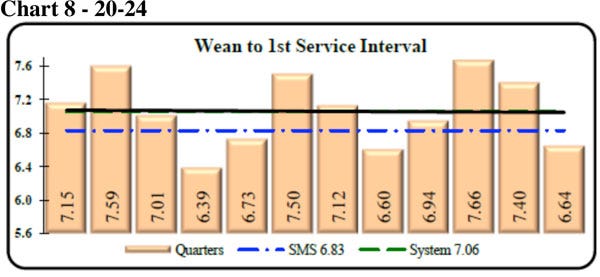
Wean-to-1st service interval is compared in Charts 4 and 8, showing the top 13 farms’ trend line going from 8.57 down to 5.12 days. These farms have likely made some changes in how they manage sows in lactation, such as increasing daily feed intake (ad-lib feeding), starting heat checks on Day 1 after weaning, and more aggressive feeding sows from weaning until they are bred. Trend lines for the lower 151 farms showed a slight improvement, although it still held at over six days.
In Charts 5 and 9, farrowing rate for the last 12 quarters shows top 30+ PW/MF/Y farms started at over 90% farrowing rate and improved to 93% or better. Farms with 20 to 23.9 PW/MF/Y held at 81.3 to 84% farrowing rates – a flat trend line.
The two subsets of farms have some areas in common, such as genetics source, similar diets, farm location, variation in farm size, etc. Some of the differences are due to management staff trying new ideas, such as more aggressive feeding in lactation and between weaning and first estrus, recording skipped estrous periods in gilts, improved Day 1 management of pigs at farrowing, more time spent attending farrowings, drying pig off at birth, more detailed analyzing of insemination technician and boar semen data, providing detailed training for farm staff, and getting employees engaged in the process of saving more of the pigs that are born. After a training session on "Improving Piglet Survival," one farm manager commented, "People save pigs," reinforcing that a staff of caring employees is needed to get to the top numbers.
Key Performance Indicators
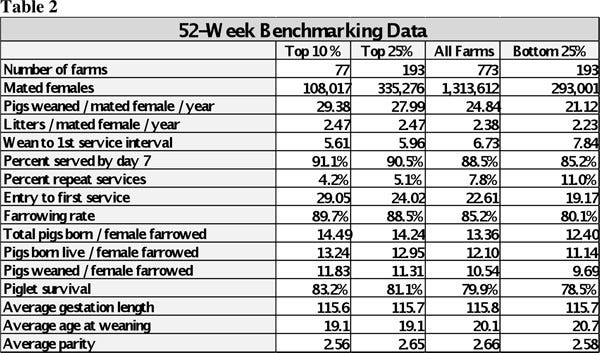
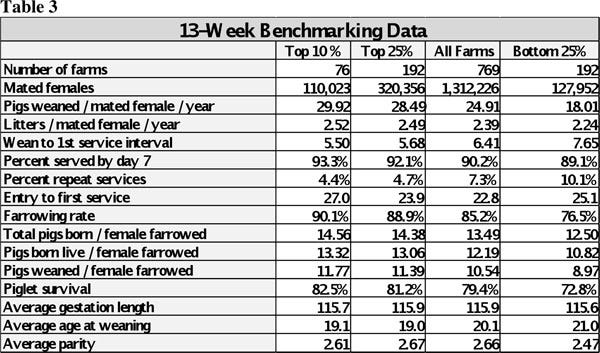
Tables 2 and 3 (below) provide 52-week and 13-week rolling averages for key performance indicators (KPI) of breeding herd performance. These tables reflect the most current quarterly data available and are presented with each column. The KPI’s can be used as general guidelines to measure the productivity of your herd compared to the top 10% and top 25% of farms, the average performance for all farms, and the bottom 25% of farms in the SMS database.
If you have questions or comments about these columns, or if you have a specific performance measurement that you would like to see benchmarked in our database, please address them to: [email protected] or [email protected].
You May Also Like
Current Conditions for
46°F
Mostly Cloudy
Day 56º
Night 46º
Enter a zip code to see the weather conditions for a different location.


