Subscribe to Our Newsletters
National Hog Farmer is the source for hog production, management and market news
June 9, 2014

This month we are going to build upon last month’s Production Preview article entitled, “How do Farms get to 30+ Pigs Weaned / Mated Female / Year?” We are going to take a detailed look at differences in parity performance.
So what are the farms at 30+ pigs doing to get more total pigs for each female? What gives top farms an advantage? Is it influenced by genetics, type of facilities, nutrition, or higher levels of day-to-day management?
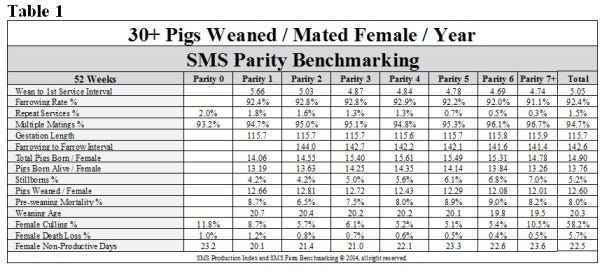
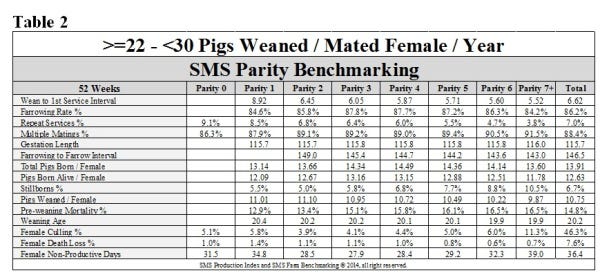
The data used for this article is from the SMS benchmarking data: Table 1, “30+ Pigs Weaned / Mated Female / Year,” has 32 farms with a total of 49,700 mated females. Table 2, “ >=22 - <30 Pigs Weaned / Mated Female / Year,” represents 598 farms with 1,060,600 mated females. The tables are laid out by Parity 0 to Parity 7+, and are broken down by 15 production numbers. The farms in the data sets have 14+ different genetic companies represented. The 32 farms that are producing 30+ pigs are using more than six different genetic companies for their female base. As far as facilities for these farms, some were built in the last few years, but many have been producing pigs for 10+ years.
The data we get from the farms does not list nutrition source, however, we know that there are probably many different nutrition packages being used by these farms. We feel higher levels of day-to-day management separate these top farms from the rest. The top farms concentrate on gilt development, maintaining experienced, long-term employees and implementing the basics 7 days a week.
Let’s see what the data says:
· Wean to 1st Service Interval: Farms producing 30+ pigs average at 5.05 days versus <30 pig farms at 6.62 days. The difference starts with P1 females at 5.66 days for 30+ farms to 8.92 for >30 farms.
· Farrowing Rate %: 30+ pig farms average at 92.4% versus >30 pig farms at 86.2%. The tables show it starts with P1 females for 30+ pig farms at 92.4% versus >30 pig farms at 87.9%.
· Total Pigs Born / Female Farrowed: 30+ pig farms average 14.90 pigs, with P1 females producing 14.06 pigs versus >30 pig farms at a farm average of 13.91 pigs with P1 females producing 13.14 pigs.
· Pigs Weaned / Female Farrowed: 30+ pig farms at 12.60 pigs versus >30- pig farms at 10.75 pigs. The 30+ pig farms weaned 12.66 pigs from P1 females versus >30 pig farms at 11.01 pigs.
· Stillborns %: 30+ pig farms with an average of 5.2% versus >30-pig farms at 6.7%. P7+ sows from 30+ pig farms were at 7.0% versus >30- pig farms at 10.5%.
· Pre-weaning Mortality %: 30+ pig farms at 8.0% pre-weaning mortality versus >30-pig farms at 14.8%. Looking at P7+ sows from 30+ pig farms at 8.2% versus >30-pig farms at 16.5%.
· Female Death Loss %: 30+ pig farms average at 5.7% verses >30-pig farms at 7.6%.
· Female Culling %: 30+ pig farms average of 58.2% versus >30-pig farms lower at 46.3%. If you look at culling for P0 and P1 females for the 30+ pigs farms, you see 11.8 and 8.7% culled versus >30-pig farms at 5.1 and 5.8%.
The tables show no difference in gestation length at 115.7 days, and weaning age at 20.2 (20.3) days. Due to higher farrowing rate, more multiple matings, and lower wean to 1st service interval, the 30+ pig farms had lower farrowing-to-farrow interval by 3.9 days per female and lower female non-productive days at 22.5 days versus >30 pig farms at 36.4 days.
So what are the top 32 farms doing to be at 30+ pigs? They know that gilt development is a key to getting gilts off to a fast start and involves making sure they get at least one recorded skipped heat, crate exposure and weight of more than 300 pounds before breeding. These farms have built facilities and have labor dedicated to gilt development. In lactation they know that nursing sows need to be able to eat all the feed they want as soon as they are done farrowing, and also concentrate on feeding extra feed from weaning to breeding in order to improve body condition, farrowing rate and total pigs born in the next litter.
Extra pigs mean that management practices have to be put in place that reduce stillborns and improve Day 1 pig management to lower pre-weaning mortality percentage. These farms are extending hours so that there is someone attending farrowing, with some units implementing 24/7 pig care in addition to providing training in Day-1 pig care. Personnel that are attending farrowing sows are able to assist by pulling pigs, drying off pigs in order to lower chilling, and making sure that split suckling is getting done with all pigs as soon as the sows is done farrowing. How does your farms compare on performance by parity?
SMS Production Index
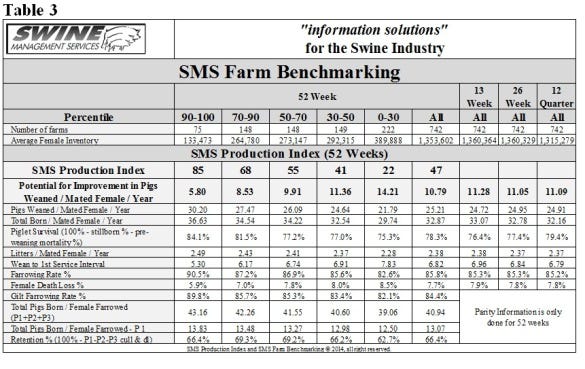
Table 3 provides the 52-week rolling averages for 11 production numbers represented in the SMS Production Index. The numbers are separated by 90-100%, the 70-90%, the 50-70%, the 30-50% and the 0-30% groups. We also included the 13-week, 26-week and 12-quarter averages. These numbers represent what we feel are the key production numbers to look at to evaluate the farm’s performance.
At SMS, our mission statement is to provide “Information solutions for the swine industry.” We feel with the creation of the new Farm Benchmarking database we now have more detailed information to share with the swine industry. If your farm would like to be part of the Farm Benchmarking database, or if you have suggestions on production areas to look at, feel free to e-mail or call us. We enjoy being a part of the National Hog Farmer Weekly Preview team.
Previous Production Preview columns can be found at www.nationalhogfarmer.com.
If you have questions or comments about these columns, or if you have a specific performance measurement that you would like us to write about, please contact: [email protected] or [email protected].
You May Also Like
Enter a zip code to see the weather conditions for a different location.


