Subscribe to Our Newsletters
National Hog Farmer is the source for hog production, management and market news
May 13, 2013

As a service to Swine Management Services (SMS) subscribers, we continue to look for production numbers or combinations of numbers that have the greatest influence on farm production levels.
We have written a new Executive Summary and Production Index for SMS subscribers that includes more parity performance data (Figure 1).
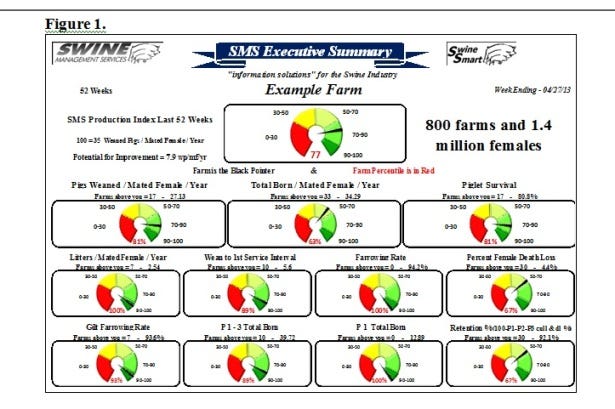
Traditionally, we look at pigs weaned/mated female/year (PW/MF/Y). While this figure remains a major part of the production index, we are also looking at other data points that could drive it even higher. Our benchmarking program now ranks farms from No. 1 to No. 800 on PW/MF/Y and total born/mated female/year.
Like what you’re reading? Subscribe to the National Hog Farmer Weekly Preview newsletter and get the latest news delivered right to your inbox every Monday!
The SMS Production Index cannot be calculated from a farm's production records because it uses the percentile ranking in the 11 production numbers for the farm against the entire database of 800 farms. We calculate that 100 on the SMS Production Index would be equal to 35 PW/MF/Y. Each farm’s percentile ranking in the database appears in red in Figure 1. The 11 production data points contributing to the production index are not all weighted the same. Those data points include:
· Pigs weaned/mated female/year (PW/MF/Y), developed by National Pork Producers Council (NPPC) for Production & Financial Standards, is the traditional measure of farm efficiency.
· Total born/mated female/year, also a NPPC calculation, gives more credit to the genetic companies that have driven total born up to more than 15pigs/litter on some farms. We feel this figure needs to be elevated in importance to make sure the farm is getting the most benefit from genetic improvement.
· Piglet Survival % (100 - stillborn % - preweaning mortality); most farms lose too many pigs before weaning. A year ago, we calculated that $1.5 billion worth of pig mortalities are carried out of farrowing rooms in a bucket.
· Litters/mated female/year; this is a traditional measure of female efficiency in NPPC Production & Financial Standards. It includes farrowing rate, female death loss, days to estrus, wean-to-service interval, etc.
· Wean-to-first service interval is a key driver for improving farrowing rate and total born on the subsequent litter. This number is driven by how well sows are fed in lactation, from weaning to breeding, as well as a gilt development program and how Parity 1 females are handled from farrowing until they are bred back.
· Farrowing rate % is related to the SMS Fertility Triangle, reflecting the variability in boar semen, sow herd composition and breeding technician capabilities. A 4% change in farrowing rate could help or hinder PW/MF/Y by up to 1.35 pigs.
· Female Death Loss %. While this figure is often a low priority, it is important to remember that a change of just 1% will shift PW/MF/Y up or down by 0.25 pigs. And, not only is the cull value of the sow lost, but the potential income from her pigs is lost as well.
· Gilt farrowing rate %. This figure is being added to the index to show the importance of getting gilts off to a good start and bred. In most farms, the highest percentage of animals bred each week is new gilts.
· Parity 1-3 total born (sum of total born in Parities 1 through 3); this new data point will reflect how new females are handled from gilt development through their third parity. Additionally, it will serve as a measure of the Parity 2 slump often seen on some farms.
· Parity 1 total born. This figure has been talked about for years because it is commonly held that the total pigs born in a gilt’s first litter sets the productivity level for her lifetime. The figure also serves as a measure of genetic potential and as a reflection of the gilt development program.
· Parity 1-4 retention rate %. This figure reflects how well gilts are being managed and developed before breeding; it is an important figure for anyone trying to maximize sow longevity. Since some farms only enter gilts at breeding time, we are only able to capture this information starting at breeding. This will not reflect the loss of gilts in the gilt development unit.
We feel that the farms that want to get an extra pig or more per litter, or want to reach a goal of 30+ pigs/mated female/year, will need to look at these 11 areas to get there. Fine-tuning the standard operating procedures in key areas, coupled with continuous employee training programs, will help elevate any farm’s production levels.
More information about our new program will be rolled out at World Pork Expo on Thursday, June 6 in the Walnut Center on the Iowa State Fairgrounds at 1:00 and 2:30 p.m. Come join us.
Past “Production Preview” columns can be found at www.nationalhogfarmer.com. Click on “newsletters,” then the respective date of the Weekly Preview issue you are interested in.
Key Performance Indicators
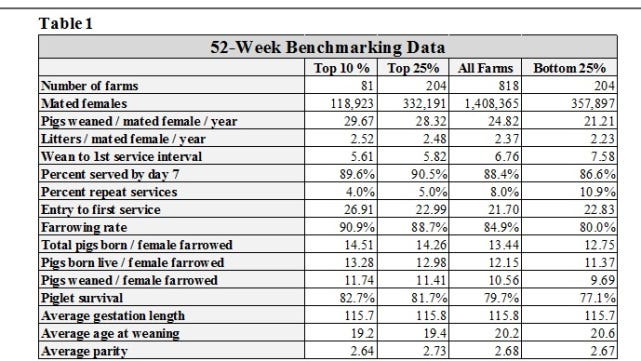
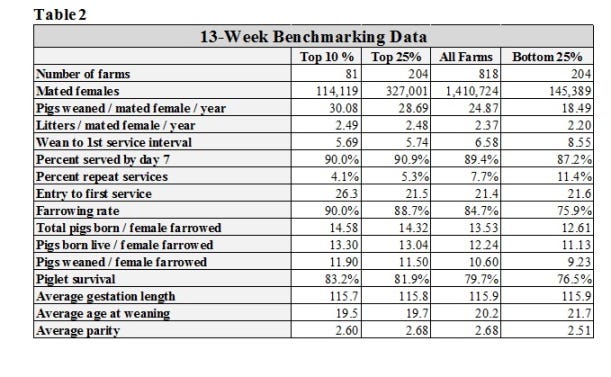
Tables 2 and 3 provide 52-week and 13-week rolling averages for key performance indicators (KPI) of breeding herd performance. These tables reflect the most current quarterly data available and are presented with each column. The KPI’s can be used as general guidelines to measure the productivity of your herd compared to the top 10% and top 25% of farms, the average performance for all farms, and the bottom 25% of farms in the SMS database.
If you have questions or comments about these columns, or if you have a specific performance measurement that you would like to see benchmarked in our database, please address them to: [email protected]or [email protected].
You might also like:
Digging Deep into Parity Records to Optimize Sow Herd Performance
You May Also Like
Enter a zip code to see the weather conditions for a different location.


