Subscribe to Our Newsletters
National Hog Farmer is the source for hog production, management and market news
September 8, 2014

This is our 100th column that we have written for National Hog Farmer’s “Weekly Preview” over the last 5 ½ years. Who would have thought we had that much to say.
The farms selected for this column could not have one quarter with fewer than 24 total born per mated female per year over the last three years. This eliminated all starts ups, repops and major disease breaks. Then farms with over a 10% decrease in pigs weaned per mated female per year quarter-to-quarter were eliminated to catch other disease breaks. We ended up with 223 farms and 400,641 mated females. Of the 646 farms we started with, only 34% had not had a major disease break in the last three years. The 223 farms were ranked by total born per female farrowed for the last quarter.
Genetic companies say there is a 1.5% genetic improvement per year. The Swine Management Services Benchmarking Summary for the last 10 years displayed in Chart 1: “Total Born / Female Farrowed” shows a 2.1% increase per year for all the farms and a 2.0% increase for the Top 10%.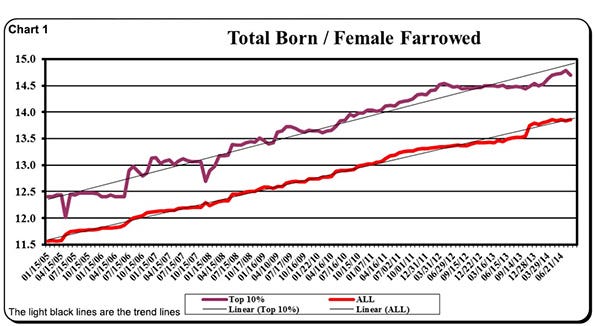
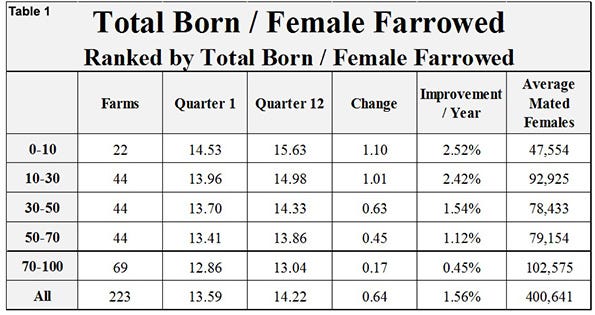
Chart 2: “Total Born / Female Farrowed” is broke out by the Top 10%, 10-30%, 30-50%, 50-70%, 70-100% and All Farms. For the All Farms the improvement is 1.56%, 13.59 to 14.22. But not all farms showed the same improvement, even though most of the farms had females with the same genetic potential. Farms in the Top 10% had a 2.52% improvement, 14.53 to 15.63. The 10-30% farms had a 2.42% improvement, 13.96 to 14.98 The 30-50% farms had a 1.54%, 13.70 to 14.33, and the 50-70% farm 1.12%, 13.41 to 13.86. The bottom 30% (70-100%) farms showed only a 0.45% improvement, 12.86 to 13.04. These numbers are shown in Table 1: “Total Born / Female Farrowed.” 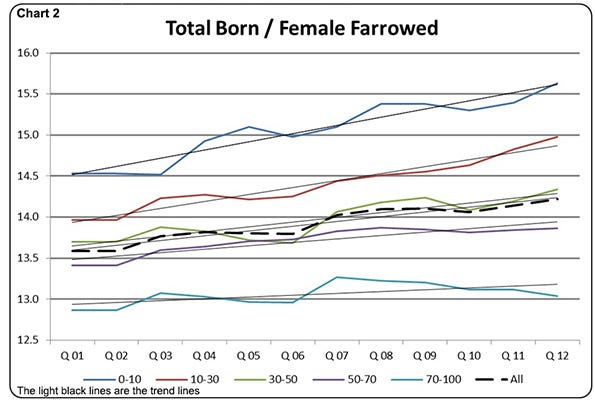
 Improvement in total born starts with using F1 females, high herd health, proper gilt selection and development, feeding right diets, timely boar exposure of gilts, recorded skip heat of gilts, crate breaking, monitoring semen handling, proper artificial insemination (AI) technique and reduced single matings. It continues for the older parity females with maximum feed intake in lactation, full flushing of weaned sows from weaning to breeding, proper use and timing of vaccinations, early boar exposure to weaned sows, monitoring of semen and proper handling, and trained breeders that have proper AI technique and reduced single matings.
Chart 3: “Total Born / Mated Female / Year” is broke out by the Top 10%, 10-30%, 30-50%, 50-70%, 70-100% and All Farms. Remember that half of the equation for total born per mated female per year is total born per female farrowed the other half is litters per mated female per year. Litters per mated female per year is driven by lactation length, wean to first service interval, days to fine returns and farrowing rate. All farms showed a 1.92% improvement in total born per mated female per year improvement for the last three years going from 32.81 to 34.70 pigs, or a difference of 1.89 pigs.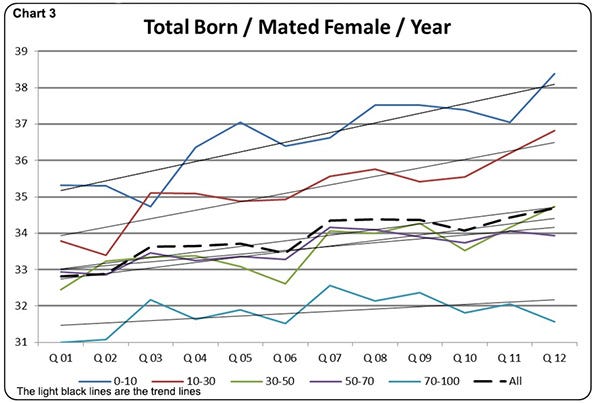
Again the improvement is not equal on all farms; the Top 10% had a 2.90% improvement per year going from 35.31 to 38.38 pigs. The farms at 70-100% only had a 0.62% improvement which was only 0.58 pigs. Both wean to first service interval and farrowing rate are key drivers in total pigs born. They are both driven by increased feed intake in lactation, and flushing weaned females after weaning until bred. Table 2: “Total Born / Mated Female /Year” contains the numbers talked about in this paragraph.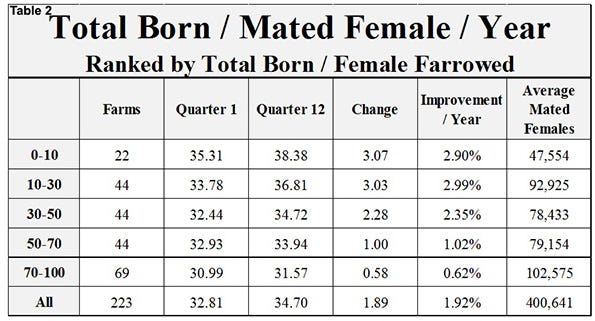
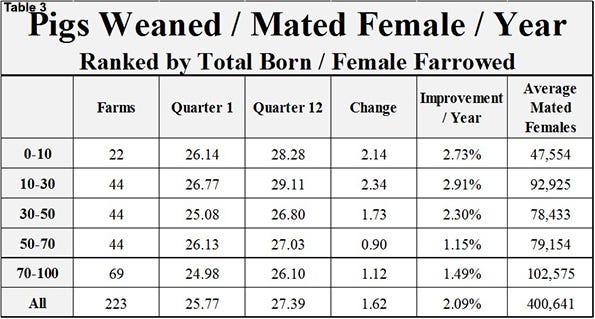
In Chart 4: “Pigs Weaned / Mated Female / Year” farms were sorted by pigs weaned per mated female per year and broken out by the Top 10%, 10-30%, 30-50%, 50-70%, 70-100% and All Farms. In Table 3: “Pigs Weaned / Mated Female / Year,” the data shows over the last three years the Top 10% of the farms improved from 26.14 to 28.28 pigs, an improvement of 2.14 pigs. The bottom 30% (70-100) went from 24.98 to 26.10, which was 1.12 pigs or a 1.49% improvement per year. Interesting to note that the 70-100% group in three years improved to 26.10 pigs where the Top 10% started at three years ago at 26.14 pigs. The difference between total born and pigs weaned per mated female is how many pigs are lost as mummies, stillborns or to piglet death loss.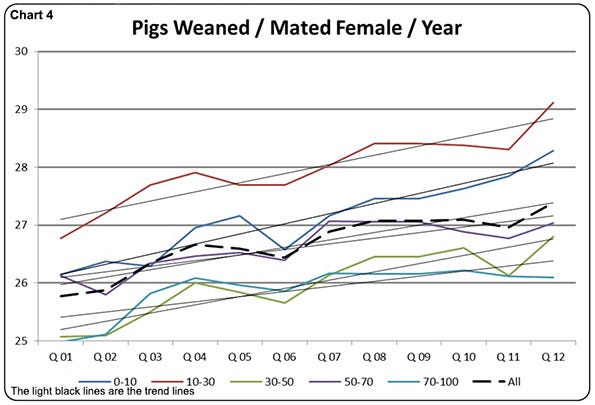
We created a term “Piglet Survival” several years ago to take out the confusion between how stillborns and piglet deaths are recorded in the records. The calculation for Piglet Survival is 100% minus the percent stillborns and the percent pre-weaning death loss. As we review farm data we see the top farms that are getting extra pigs born have figured out how to lower both stillborns and pre-weaning death loss. Stillborns can be dramatically reduced by attending more sows farrowing with the top farms having stillborn less than 3% or 0.40 stillborns per female farrowed. The top farms for pre-weaning death loss are less than 5.0%. Pre-weaning death loss can be reduced by improving Day 1 pig care during farrowing, drying pigs at birth, improved colostrum management with split suckling, proper processing technique, finding more fallback pigs earlier and improving how to manage these pigs and in lactation feeding having sows on full feed to reduce stress on the sows.
If your farm is not improving at 1.5% or more per year in total pigs born you may need to make some changes to your farm procedures to get those extra pigs and be able to save them in farrowing.
SMS Production Index
Table 4 provides the 52-week rolling averages for 11 production numbers represented in the SMS Production Index. The numbers are separated by 90-100%, the 70-90%, the 50-70%, the 30-50% and the 0-30% groups. We also included the 13-week, 26-week and 12-quarter averages. These numbers represent what we feel are the key production numbers to look at to evaluate the farm’s performance.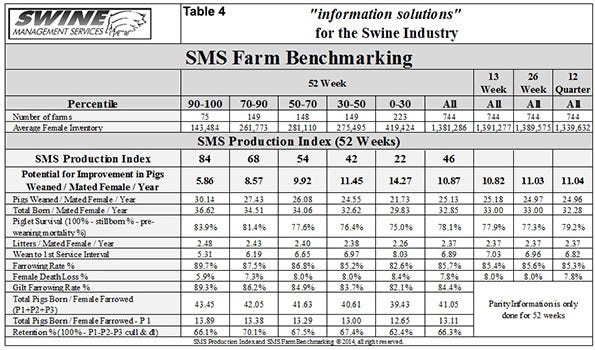
Thank you for reading our columns for 5+ years.
At SMS, our mission statement is to provide “Information solutions for the swine industry”. We feel with the creation of the new Farm Benchmarking database we now have more detailed information to share with the swine industry. If your farm would like to be part of the Farm Benchmarking database, or if you have suggestions on production areas to write columns about, please e-mail or call us. We enjoy being a part of the National Hog Farmer Weekly Preview team.
If you have questions or comments about these columns, or if you have a specific performance measurement that you would like us to write about, please contact [email protected] or [email protected].
Previous Production Preview columns can be found at www.nationalhogfarmer.com.
You May Also Like
Enter a zip code to see the weather conditions for a different location.