Subscribe to Our Newsletters
National Hog Farmer is the source for hog production, management and market news
March 31, 2014

USDA’s quarterly Hogs and Pigs Report indicates significantly larger-than-expected market hog inventories and farrowing intentions. Further, the inventory figures show numbers that are FAR greater than the ones I have derived using porcine epidemic diarrhea virus (PEDV) case accession data. The numbers were deemed to be bearish – and pretty severely so.
While some readers may want to begin preparing the crow I may ultimately have to eat, I think I’ll pass on beginning that meal for the moment. And Monday’s futures market action suggests that I may not have to eat it at all.
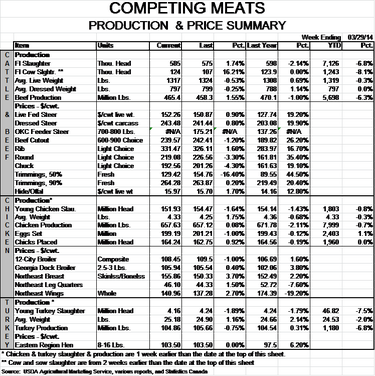
The key national data from Friday’s report appear in Figure 1.
Figure 1
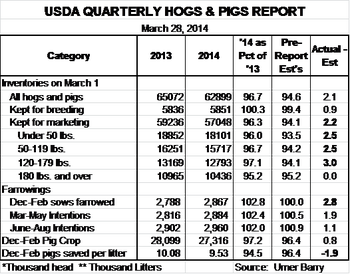
Here are the most critical of those figures and their implications:
The market herd was estimated to have been 3.7% smaller than one year ago on March 1. Weight category inventories suggest that summer 2014 slaughter will run from 2 to 4% lower than year-ago levels. These numbers are important in that, when combined with higher slaughter weights seen this year and expected this summer, they would result in summer pork production very close to that of 2013. So, this report implies that any increase in prices would have to be demand-driven.
The market herd inventories do not reflect the sharp declines in slaughter that have been witnessed in March, and do not fit with the September-November pig crop. USDA’s 180-pound and over inventory was 4.8% lower than one year ago, while March weekly slaughter totals have been, on average, 6.7% lower. Further, those sharply lower slaughter totals come from a September-November pig crop that is still estimated by USDA to be the same size as one year earlier.
The breeding herd is estimated to have numbered 5.851 million head on March 1. That is 0.3% larger than one year ago and nearly 1 full percentage point larger than analysts had expected. It is also 94,000 head larger than on December 1. The University of Missouri reports that gilt slaughter through the first 10 weeks of 2014 was 0.2% larger. Q1 slaughter of U.S. sows (i.e. omitting Canadian sows) was down 2.5% or just 14,000 head from last year. We don’t see how those figures would add up to 94,000 more sows.
The December-February pig crop is estimated at 27.316 million head, 2.8% lower than last year. That total is driven lower by sharply smaller litters (9.53 pigs, down 5.5% from last year and the smallest since the December-February crop reported in the March 2009 report) but is increased by farrowings estimated to be 2.8% LARGER than one year ago – from a breeding herd that was 1% smaller on December 1, and virtually even with last year on March 1.In addition, intended farrowings from that herd are up 2.4% and 2% the next two quarters. All of those farrowing numbers look large versus the herd size, but there could be some increases driven by odd re-breeding patterns for sows that lost litters to PEDV. They could, I suppose, be possible.
Finally, USDA’s state-level production data indicates December-February pig crops in Iowa, Minnesota and Illinois – three states hit particularly hard by PEDV this winter -- are 2%, 5% and 3% LARGER than last year. Those data are in sharp disagreement with anecdotal evidence from producers, packers and veterinarians in those states, and with state-by-state PEDV case accession data published by the American Association of Swine Veterinarians (AASV). Further, they do not seem to fit breeding herd, farrowing and litter-size data for the past three quarters (See Figure 2). In fact, the only state among those most hard-hit by PEDV for which USDA’s data appears reasonable is North Carolina. So anyone who thinks this has anything to do with “the big guys” not cooperating should probably think again.
Figure 2
The magnitude of pig losses to PEDV is still unknown, and available data are conflicting.PEDV case accessions at animal disease diagnostic laboratories rose dramatically this winter and suggest slaughter levels could be 10% or more below year-ago levels this summer, according to reports published by Paragon Economics, Rabobank North America and others.
USDA’s quarterly Hogs and Pigs Report for March indicates much smaller year-on-year reductions than PEDV case data suggest. The Hogs and Pigs Report data would be deemed by most analysts to be more reliable than the case accession data since it results from a well-known and proven methodology at USDA.The report is, however, based on samples, surveys and statistical estimates that can and do sometimes result in errors. The futures market on Monday seems to be at least partially dismissing the USDA numbers.
About the only thing that is certain is that the “true” numbers for today’s market inventories will be known only when slaughter levels are observed in the weeks and months to come.
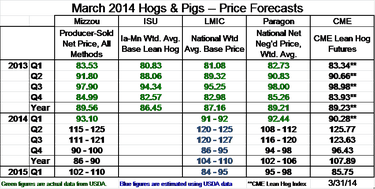
Our quarterly compilation of analysts’ slaughter and price forecasts appear in Figures 3 and 4. Iowa State University’s forecasts were not available at press time.
Figure 3
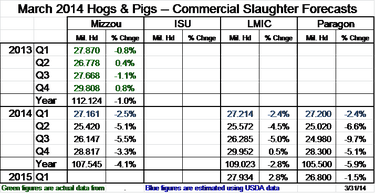
Figure 4
You May Also Like
Current Conditions for
48°F
Mostly Sunny
Day 56º
Night 46º
Enter a zip code to see the weather conditions for a different location.


