Frequently reported in diagnostic PCRs results, Ct values may require extra attention when interpreting results.
January 30, 2018
By Ana Paula Poeta, University of Saskatchewan Western College of Veterinary Medicine and University of Rio Grande do Sul Faculty of Veterinary Medicine; John Harding, University of Saskatchewan Western College of Veterinary Medicine; and Matheus de O. Costa, University of Saskatchewan Western College of Veterinary Medicine and Utrecht University Faculty of Veterinary Medicine
Porcine reproductive and respiratory syndrome is a production-limiting disease of pigs across the world. In breeding and farrowing herds, PRRS infection affects farrowing rates and the number of weaned pigs (Pileri and Mateu, 2016). Furthermore, growing and finishing pigs suffer from secondary infections and increased mortality due to PRRSV co-infection with other pathogens (Pileri and Mateu, 2016). Due to its economic impact (both at the regional and global levels), accurate diagnosis of PRRSV is critical.
Quantitative real-time polymerase chain reaction is a sensitive and specific diagnostic method used to detect genomic material (DNA or RNA, indirectly) of a given pathogen in clinical samples (Larionov et al, 2005). The qRT-PCR method uses small DNA molecules, called primers, designed to specifically target the genome of a pathogen of concern, e.g. PRRSV. Primers react with the genomic material present in the sample over a series of 35 to 40 thermocycles. If a matching sequence is detected, even at very low amounts, the primers will bind and initiate a sequence of events that lead to the production of a duplicate copy of the sequence, called an amplicon.
The length of amplicon is dictated by the distance between a pair of primers; one positioned at either end of the amplicon, and the production of an amplicon is accompanied by the release of a fluorescent signal. After a given number of cycles, positive samples will produce enough fluorescent signal to be detectable by the machine. The threshold cycle (Ct) is the thermocycle at which enough signal was produced from a sample to be considered positive (Figure 1, steps 1-4). The greater the concentration of genomic material in the clinical sample at the start, the stronger the signal and the fewer cycles required for a positive result (lower Ct value). Although in theory, the number of amplicons should double with each thermocycle, there are many factors that can affect the efficiency of the reaction. Accurate quantification of viral load (for PRRSV, for example) in a given sample is achieved by comparing the relative fluorescence of a clinical sample to that of a standard curve, a series of five to seven samples with known quantities of genomic material (reference samples).
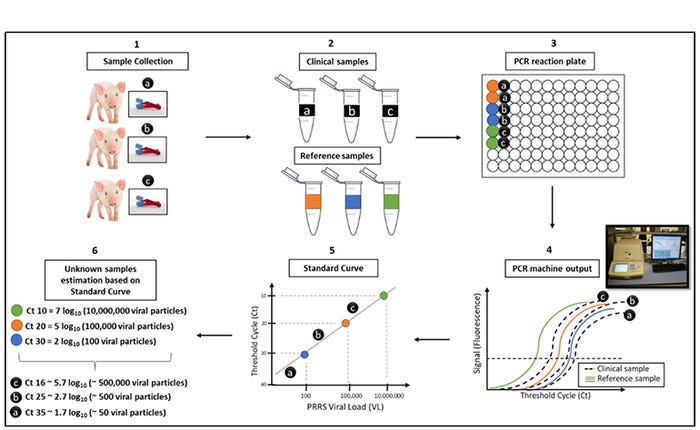
Figure 1: qRT-PCR assay using standard curve and an example of PRRS viral load diagnostic report. (1) Clinical samples collection in the field. (2) Clinical (unknown viral load, black) and reference (known viral load, coloured) samples are processed in the lab. (3) PCR reaction plate with reference (colored wells) and clinical samples (black wells) in duplicates. (4) DNA amplification plots of a qRT-PCR machine output; fluorescent signal baseline (horizontal dashed line) per Ct of reference (coloured lines) and clinical samples (black lines). (5) Viral load from reference samples (coloured circles) and clinical samples (black circles) estimated based on standard curve calculations. (6) Number of PRRS viral particles from clinical samples are estimated based on the standard curve plot from reference samples.
The viral load of any test sample can then be determined by simple interpolation of Ct values onto the standard curve (Figure 1, steps 5 and 6). To control for laboratory factors (e.g. technician and reagents), a standard curve should be run on each PCR plate. However, this approach adds substantial cost since running a standard curve on each plate requires expensive laboratory reagents and displaces other clinical samples that could otherwise be run. The alternative is to crudely estimate viral load based on Ct values, with the understanding that viral load increases with decreasing low Ct values.
The objective of this study was to determine if the estimation of the viral load using Ct values differs from that estimated using a standard curve. For this purpose, blood samples were collected from gilts experimentally inoculated with PRRSV-2 at Day 85 of gestation. Following laboratory processing, qRT-PCR was used to assess total PRRS viral load based on standard curve and Ct analyses. A total of 12 PCR reaction plates containing samples from 90 different gilts were used. On average, PRRS viral load detected in the samples was 3.03 log10 copies/microliter of serum, and it ranged from 1.90 to 4.35 log10.
Across all samples, the Ct values ranged from 25 to 29. Figure 2 shows the difference between the viral load calculated using the standard curve and its associated Ct, between the 12 PCR reaction plates studied. For example, for samples with a Ct=27 (27.0 to 27.9) the viral load calculated based on a standard curve ranged from 2.0 and 3.5 logs10 copies/microliter serum. In fact, within any Ct value between 25 to 29, the variation in viral load across all samples was about 1.5 log10 copies. Figure 2 also shows the variation of reference samples (with known viral load) between plates. For example, the reference sample containing 3 log10 PRRS viral particles had Ct values ranging between 25 and 29 in this study.
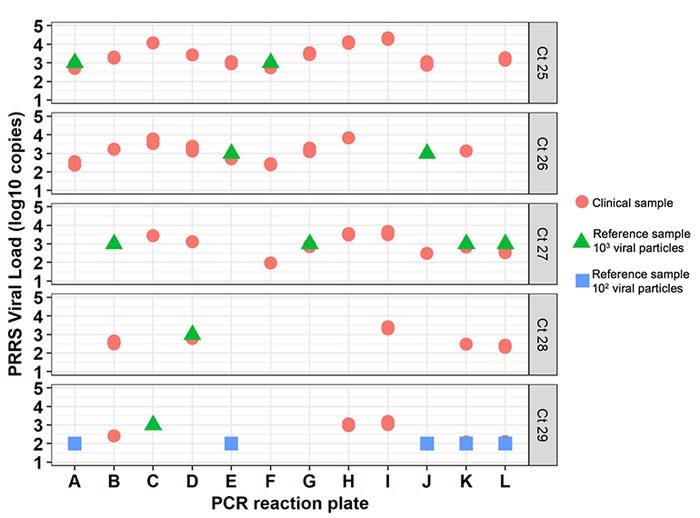
Figure 2: Estimated clinical samples PRRS viral load (log10 copies per microliter, Y-axis) from 12 PCR reaction plates (letters on X-axis). This figure shows the variability of viral load across a wide range of Ct values. Each plot contains clinical samples (shown as red circles) and reference samples (from the standard curve, triangles and squares) detected for a given Ct. All Ct values rounded to whole numbers.
Even though this investigation was based on a small number of samples, we were able to verify the variability of viral load across a wide range of Ct values, that will be useful when interpreting test results based solely on Ct. Additional research, based on larger datasets using different sample types, is under way to further characterize variation in viral load across Ct values, and to assist in its use as a quantitative or semi-quantitative approach to reporting qRT-PCR results.
References
Pileri, E. and Mateu, E. Review on the transmission porcine reproductive and respiratory syndrome virus between pigs and farms and impact on vaccination (2016). Veterinary Research, 47:108, doi:10.1186/s13567-016-0391-4
Larionov, A.; Krause, A.; Miller, W. A standard curve based method for relative real time PCR data processing (2005). BMC Bioinformatics, 6:62 doi:10.1186/1471-2105-6-62.
You May Also Like

